
Fairlead’s Technical Framework,
On Demand
Technical Intelligence applies the discipline behind Fairlead Strategies research to the securities you follow. Look up a stock, ETF, or Treasury yield and see an automated reading of its short, intermediate, and long-term trends, its momentum, and the levels that matter.
One consistent technical framework, applied to your own list
Fairlead Strategies research covers the market’s most important trends every day and every week. Technical Intelligence extends that framework to individual securities, reading every one the same way so the results are like for like.
Each analysis reads trend, momentum, and key levels across the short, intermediate, and long term, with a written Technical Summary, plain-English notes on what each reading means, and Slack Tide signals for potential turning points. Readings are built from completed daily closes. Technical Intelligence runs in any modern browser on a computer, tablet, or phone, with nothing to install.
From ticker to technical picture in seconds
Each analysis leads with the summary reading, then lays out the chart, levels, and detail behind it.
Screenshots show different securities, chosen only to illustrate the features. They are not recommendations.
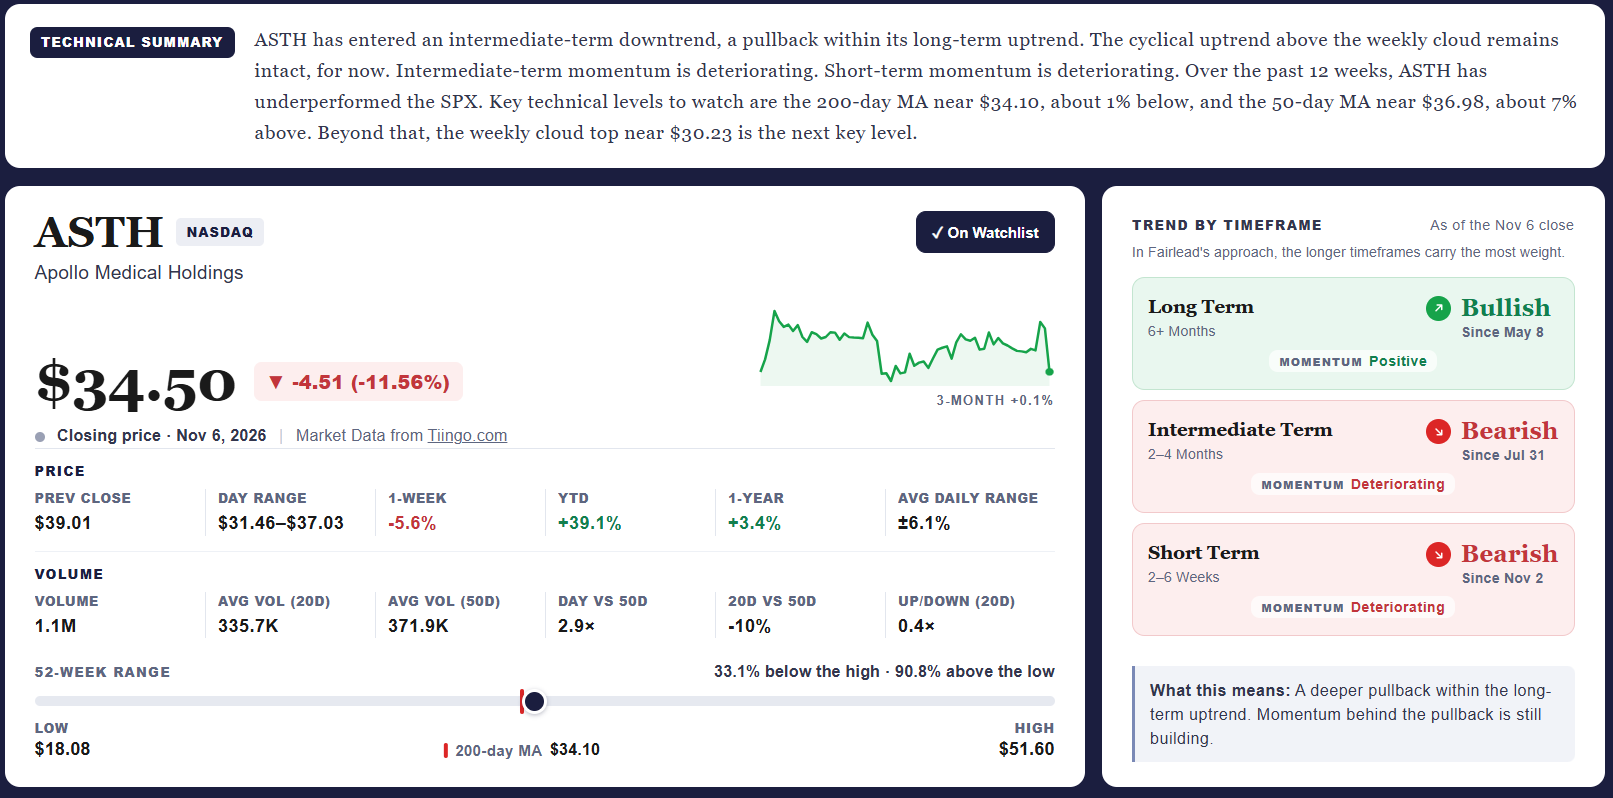
Trend by Timeframe and Technical Summary
Start with the short, intermediate, and long-term trends and a written Technical Summary generated automatically from the readings.
- Bullish, Neutral, or Bearish on each timeframe
- The longer timeframes carry the most weight
- Plain-English “What this means” notes
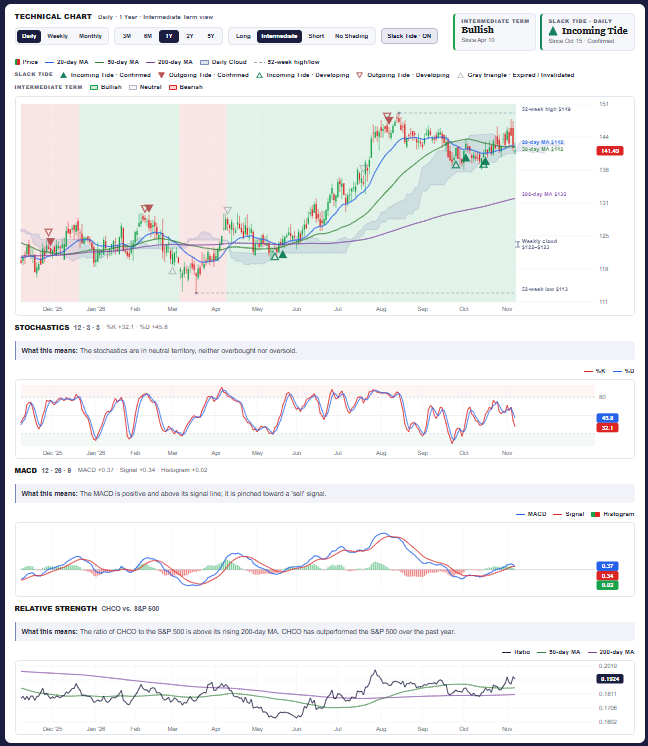
Technical Chart
A daily, weekly, or monthly price chart that puts today’s reading in context, with the short, intermediate, or long-term trend history shaded behind price.
- Key moving averages and the daily cloud
- Slack Tide signals for potential turning points
- Stochastic, MACD, and relative strength panels
- A “What this means” note on each panel
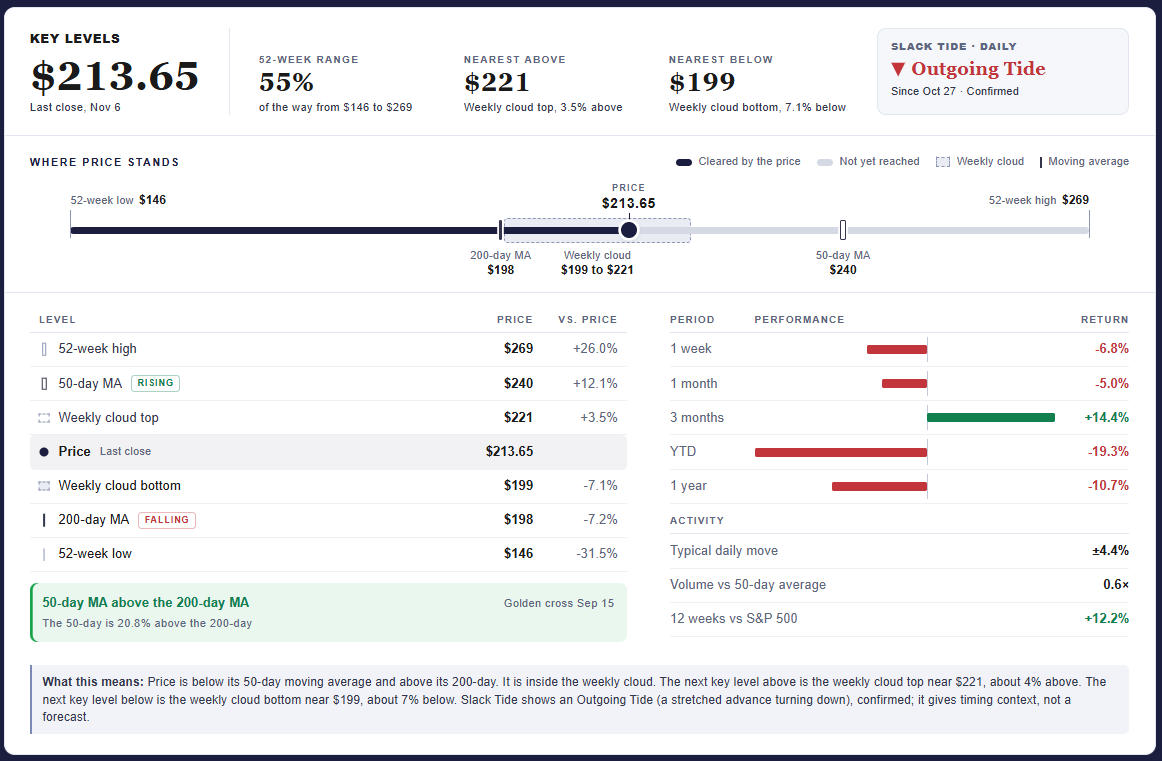
Key Levels and Where Price Stands
The key levels that frame the technical picture, the 50-day and 200-day moving averages, the weekly cloud, and the 52-week range, each with how far price sits from it, alongside the latest Slack Tide signal.
- The nearest key level above and below price
- Where price stands on its 52-week range
- Performance from one week to one year
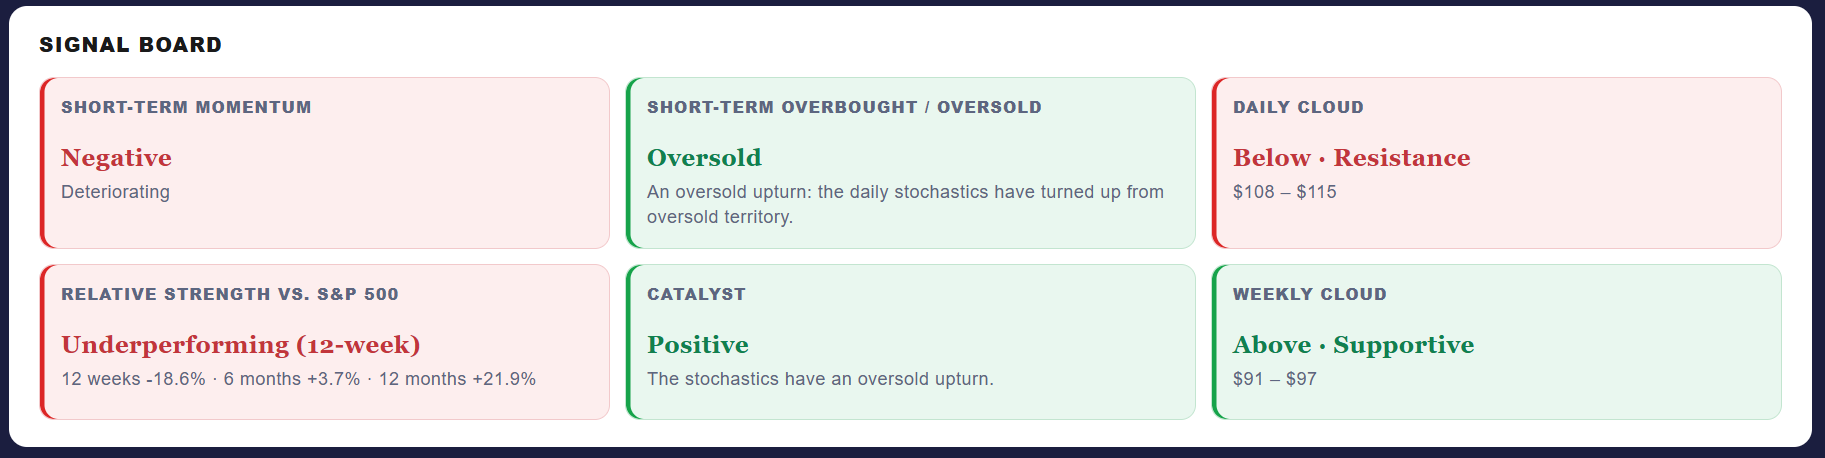
Signal Board
Every signal behind the reading in one place: short-term momentum, overbought and oversold readings, the daily and weekly cloud, relative strength against the S&P 500, and catalysts, with a plain-English note on what they mean together.
Watchlist
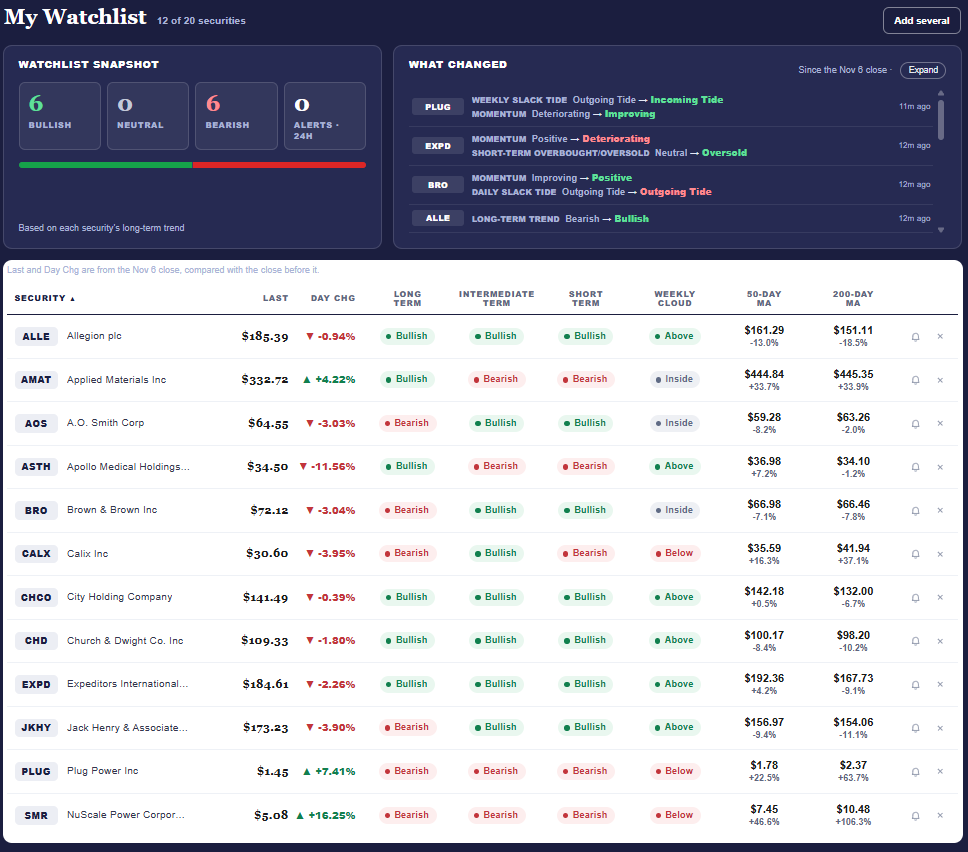
Keep the securities you follow in one place, updated after every trading day.
- Each security’s short, intermediate, and long-term trend
- The weekly cloud and moving averages for each security
- What Changed since the last close
- A snapshot of the whole list by long-term trend
Alerts
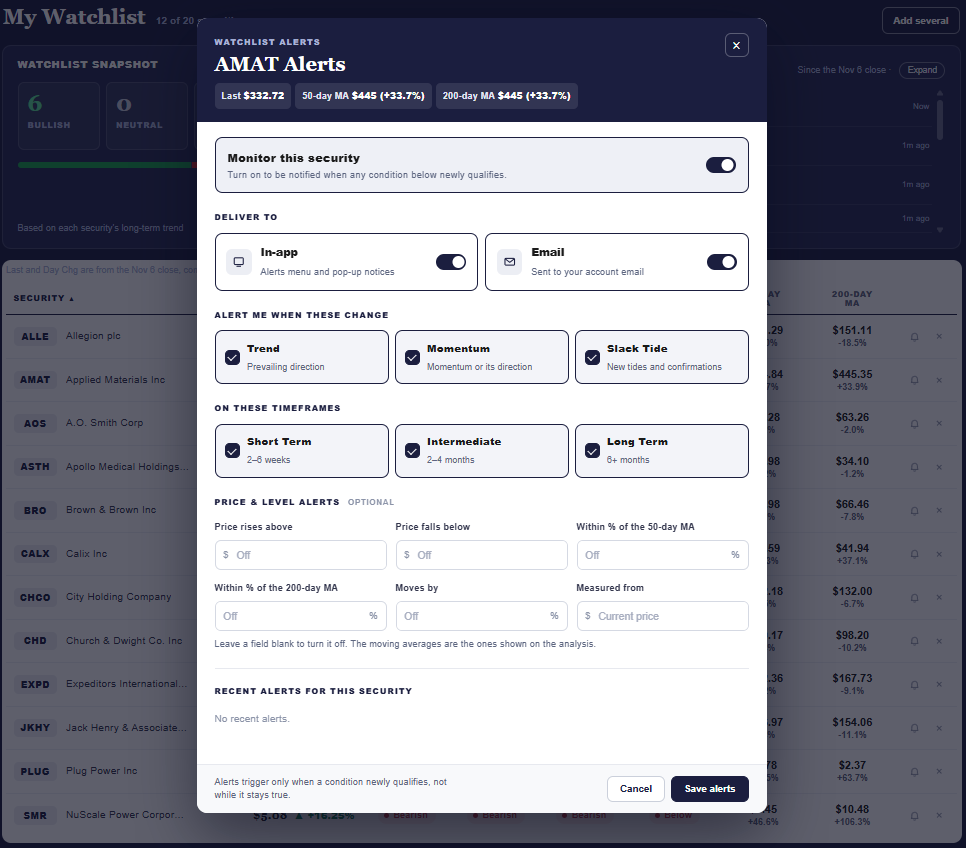
For each security on your watchlist, choose what you want to hear about.
- Trend, momentum, and Slack Tide changes
- On the short, intermediate, or long term
- Optional price and moving-average alerts
- In the app, by email, or both
- Only when a condition newly qualifies
- Sent once each trading day, in the evening after the market closes, typically between 9 and 10 PM Eastern
Sea State
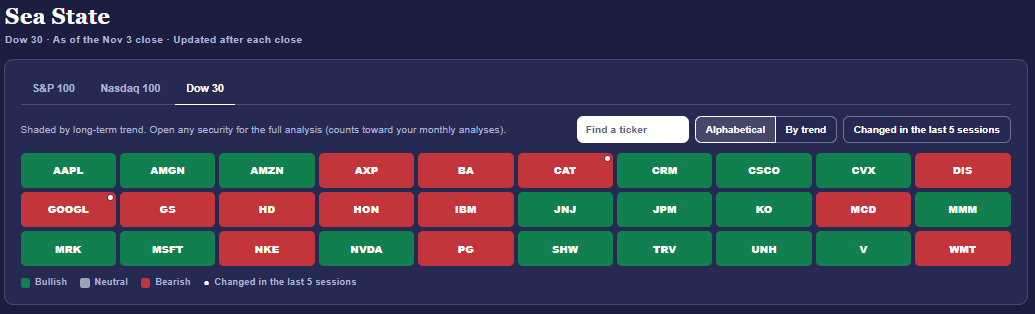
See a whole index at a glance. Sea State maps the S&P 100, Nasdaq 100, or Dow 30, with each company shaded by its long-term trend. Open any box for its full analysis.
- S&P 100, Nasdaq 100, and Dow 30
- Each company shaded Bullish, Neutral, or Bearish
- Browsing the map does not use an analysis
A practical workflow for every security
Four steps from a ticker to a clear technical reading, and an alert when it changes.
Analyze the securities you actually follow
Technical Intelligence is not limited to a fixed list. Apply Fairlead’s consistent technical framework to individual stocks, ETFs, and U.S. Treasury yields. The examples below are representative, not a complete list.
Stocks
Large caps, growth leaders, cyclicals, and the names in your portfolio.
ETFs
Broad market, industry, international, fixed income, and commodity funds.
Treasury Yields
The 2-, 5-, 10-, and 30-year yields from the U.S. Treasury’s daily par yield curve, read from each day’s close.
Subscribe to Technical Intelligence
Available on its own, or included in the Basic, Access, and Premium research plans.
Technical Intelligence
Automated technical readings for investors who want Fairlead’s framework on their own list, without a full research subscription.
- 50 analyses a month
- Watchlist of up to 10 securities, with alerts
- Short, intermediate, and long-term trends
- Key levels, chart, and Slack Tide signals
- Stocks, ETFs, and Treasury yields
Basic
Core equity research access, with Technical Intelligence included.
- Technical Intelligence: 50 analyses a month
- Watchlist of up to 20 securities with alerts
- Daily Starting Line report
- Weekly Fairlead Tactics report
- Weekly Sector Deep Dive report
Access
Expanded research access for teams, with a larger Technical Intelligence allowance and ETF Navigator.
- Technical Intelligence: 100 analyses a month
- Watchlist of up to 50 securities with alerts
- Everything in Basic
- Weekly ETF Navigator report
- Team access for up to 5 users
Premium
Full research access plus bespoke analysis, with the largest Technical Intelligence allowance.
- Technical Intelligence: 250 analyses a month
- Watchlist of up to 100 securities with alerts
- Everything in Access
- Technical portfolio review
- Custom analysis, filters, and scans
Need more analyses? Add a pack in Technical Intelligence or in the Fairlead portal: 10 for $25, 25 for $50, 50 for $90, or 100 for $150. Pack analyses are used after your monthly allowance and are valid for 90 days.
Annual plans are billed in two semi-annual payments.
Important Information. Technical Intelligence is an educational tool that provides automated technical readings generated by a rules-based model from completed daily closes. It is not investment advice, a recommendation regarding any security, or an offer to buy or sell securities. Readings, including the Technical Summary, are not individually reviewed or approved by an analyst and do not consider any individual’s objectives, financial situation, or needs.
Risks and Limitations. Technical analysis is inherently uncertain. Automated readings may be inaccurate, incomplete, or outdated, and may fail to reflect significant market developments. Slack Tide signals and key reference levels are technical observations, not predictions or guarantees; a signal may not be followed by a change in trend, and price may not respect a level. Investments involve risk, including possible loss of principal. Past performance is not indicative of future results.
Prices, Data and Alerts. Readings use completed daily closes and do not change with intraday prices. Stock and ETF prices come from Tiingo. During market hours the page shows the latest intraday price, derived from consolidated U.S. trading or, when that is unavailable, from IEX trading only; intraday prices may be delayed or incomplete and are shown for reference. Treasury yields come from the U.S. Treasury, as of each day’s close. Third-party data may contain errors, omissions, or delays, and Fairlead does not guarantee its accuracy, completeness, or timeliness. Alerts are generated after the close, may be delayed or missed, and should not be relied on for trading decisions.
Conflicts and Other Information. Fairlead Strategies, its affiliates, and its personnel may hold positions in or trade securities shown here, which may create conflicts of interest. Personal trading by Fairlead personnel is subject to the Firm’s Code of Ethics. Technical Intelligence does not analyze funds advised or sub-advised by Fairlead or its affiliates. Screenshots are illustrative, show readings as of the dates shown, and are not recommendations. Subscribers must accept the Technical Intelligence User Agreement before first use. Fairlead Strategies, LLC is an SEC-registered investment adviser; registration does not imply a certain level of skill or training. Please see Fairlead Strategies’ disclaimers and disclosures for additional information.
Market Data from Tiingo.com.